
What should you look for in a suburb?
As a buyers agent, you know how critical it is to match your clients with the right suburb—but with over 15,000 suburbs across Australia, pinpointing the best investment locations can be overwhelming.
That’s where Stash comes in. We analyse and rank every suburb nationwide based on key investment criteria like capital growth potential, rental yield, vacancy rates, and days on market. We’ll help you cut through the noise and identify investment-ready areas faster—so you can confidently guide your clients to the best property deals backed by data.
See it in action?
Video: What suburbs will match your next buyer’s brief?
Get a free trial
Stash partners with some of Australia’s leading buyers agents, empowering them with the tools they need to streamline the entire property-buying journey.
Become a member of Stash BA to take your buying business to the next level. Try it free for 14 days.
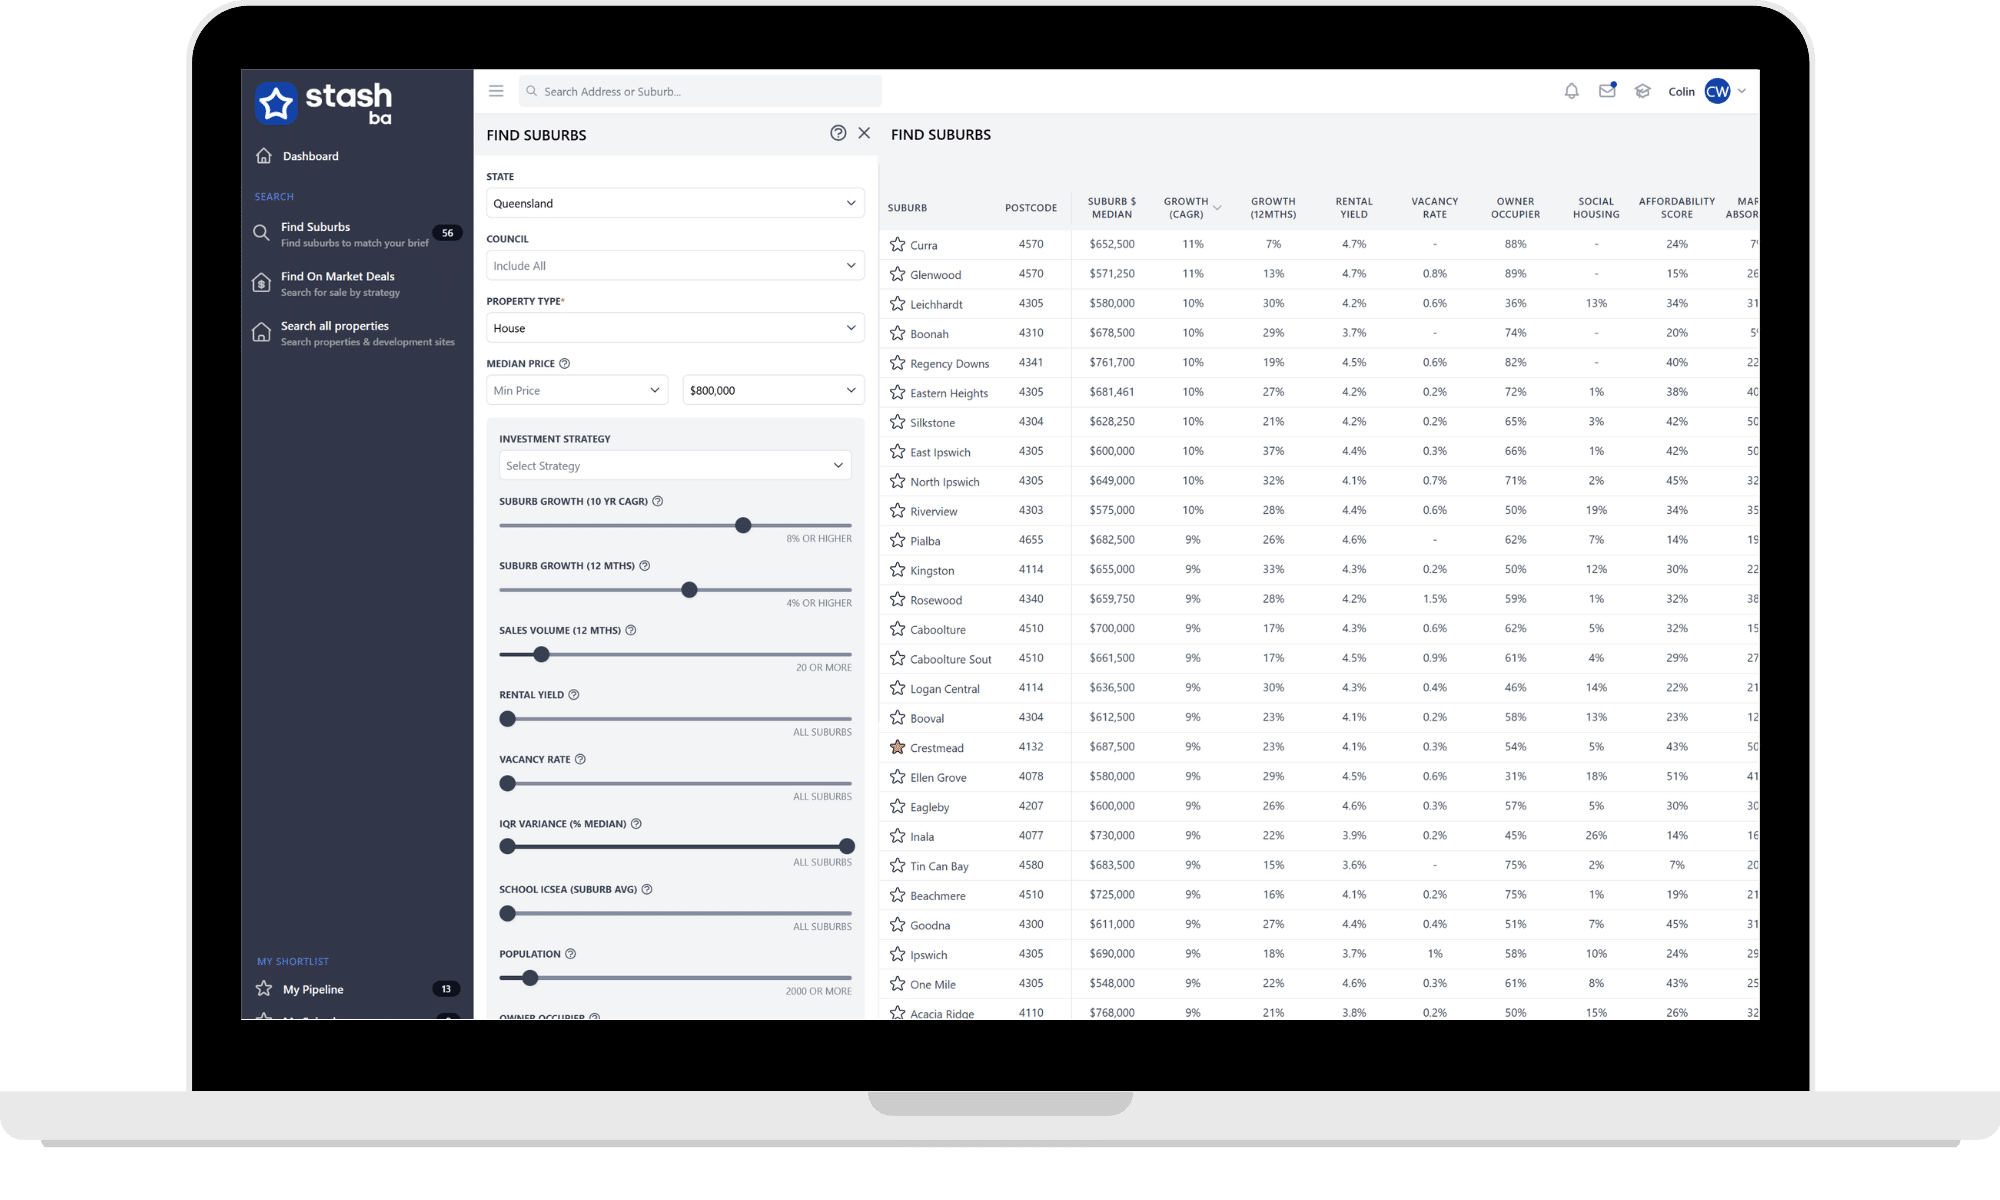
We analyse every suburb in the country and rank them based on their investment criteria.
Stash takes the guesswork out of suburb research with our powerful suburb search tool, designed specifically for buyers’ agents. Whether you’re looking for that elusive “needle in a haystack” or casting a wide net across Australia, our platform lets you explore over 15,000 suburbs with ease. Use advanced filters to zero in on key metrics like capital growth, rental yield, school quality, owner-occupier ratio, IRSAD index, days on market, population size, and more — so you can match the right suburb to your buyer’s brief, fast.
Not only can you uncover hidden gems, but you can also build tailored suburb shortlists in just a few clicks. These reports are fully customisable and perfect for presenting options to your clients in a professional, data-backed format. It’s suburb research made smarter, faster, and built to help you win more deals.
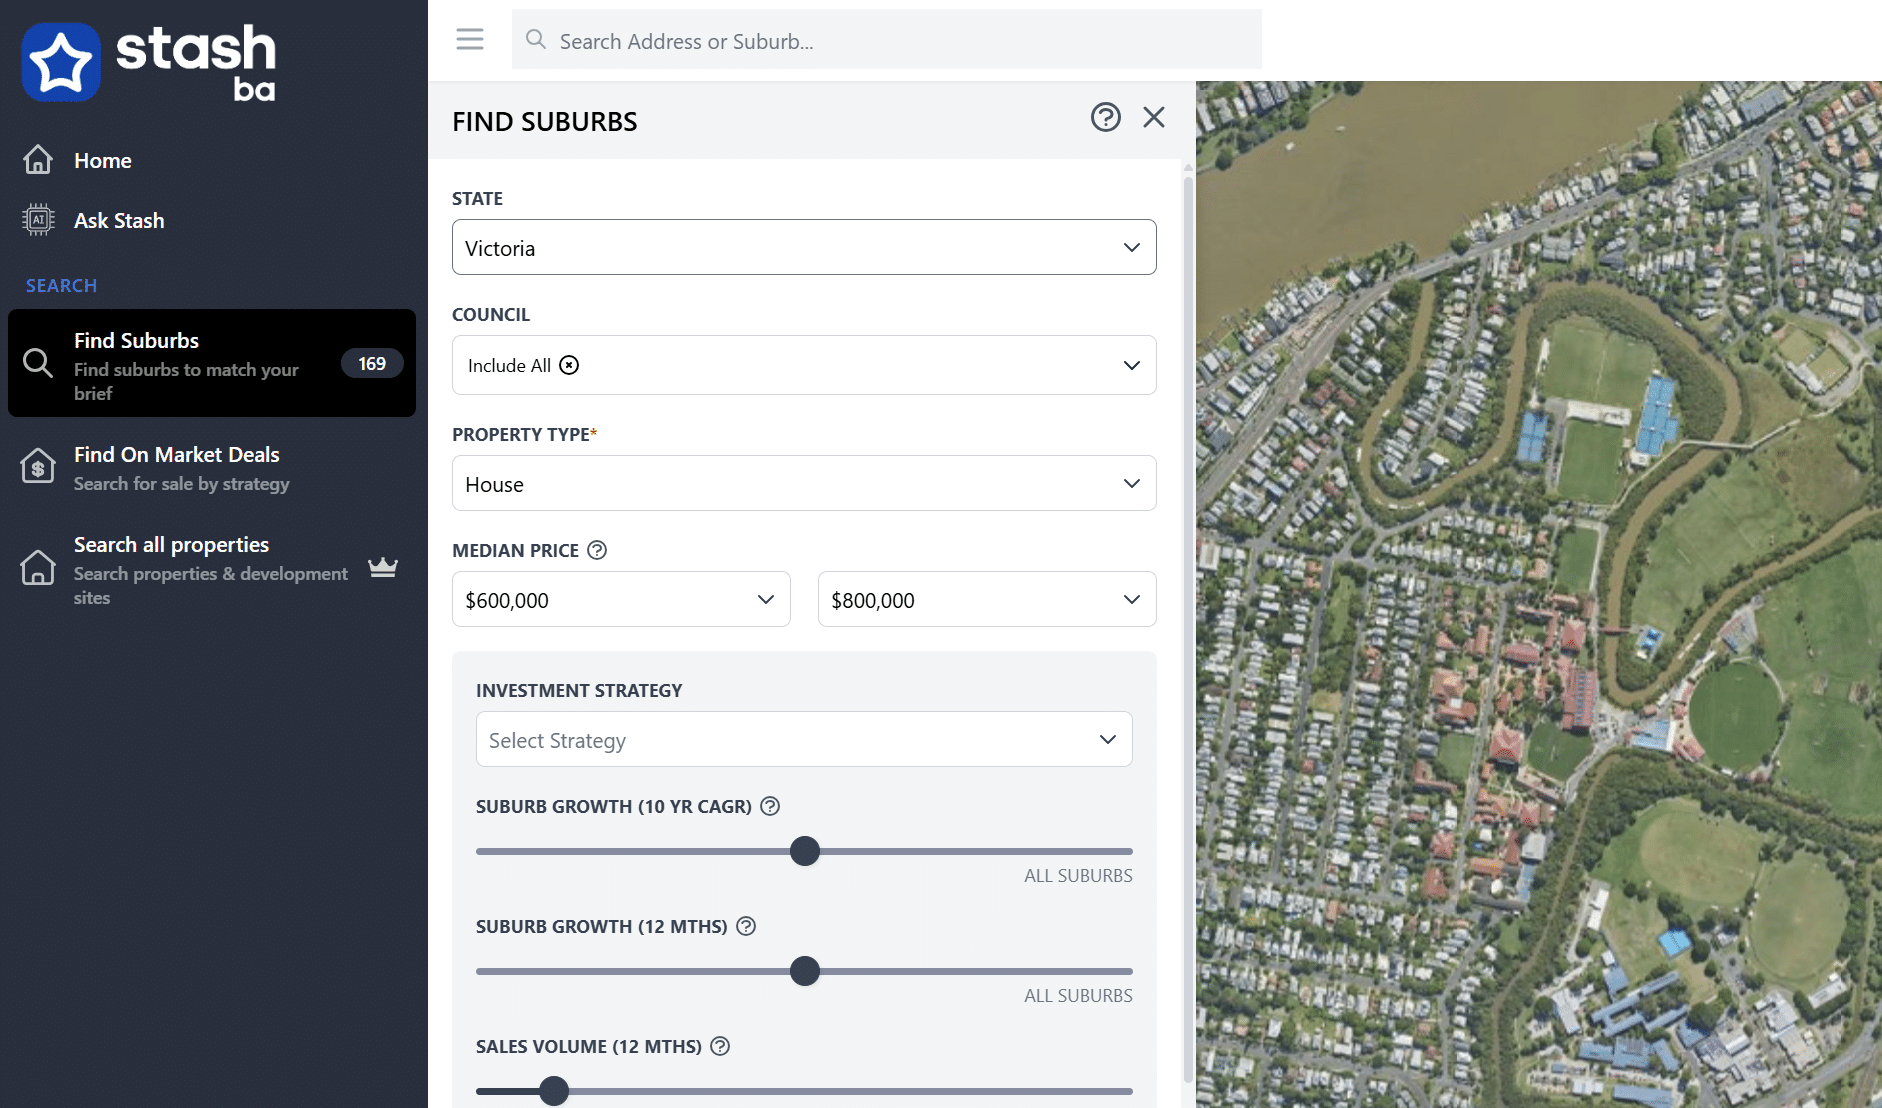
1. Start with the State, property type & budget
Begin by defining the buyer’s budget, state, and property type—for example, a client might be looking for a house in Victoria priced between $600,000 and $800,000. By applying these filters across all 15,000 suburbs in Australia, you can instantly narrow the list down to a much more manageable number—for instance, just 169 suburbs may match those exact criteria.
Understanding where property prices sit in relation to the suburb median is crucial for understanding renovator potential
2. Refine by strategy
Explore five powerful property strategies to suit different buyer goals. Whether you’re after affordable entry points, strong rental cashflow, renovation upside, school zone appeal, or long-term capital growth, these suburb types help investors and homebuyers make smarter, data-driven decisions. Match your strategy to the right suburb and unlock better property outcomes.
Most Affordable Suburbs
Discover hidden gems where property prices remain within reach. These suburbs offer excellent entry points for first-home buyers and investors looking to get into the market without overextending their budget. Affordability often correlates with higher rental yields and the potential for future gentrification.
Positive Cashflow Suburbs
Maximise your rental returns with suburbs where income exceeds expenses. Positive cashflow areas are ideal for investors focused on sustainable, income-generating assets that can help grow their portfolio faster—often supported by strong rental demand and low vacancy rates.
Renovator Potential Suburbs
Target suburbs with a high IQR % of the median to find properties ripe for renovation. These locations offer strong upside for value-add strategies, perfect for flippers or investors looking to manufacture equity through improvements and resell or rent at higher returns.
Top Public School Suburbs
Tap into the power of school zones. Properties in catchments for high-performing public schools are consistently in demand, driving both buyer competition and long-term capital appreciation. Ideal for owner-occupiers and investors alike seeking stable growth and strong rental appeal.
Long Term Capital Growth Suburbs
Invest with an eye on the future. These suburbs show consistent historical growth, strong fundamentals, and emerging infrastructure. Ideal for investors prioritising wealth creation over the long term, underpinned by population growth, low supply, and economic expansion
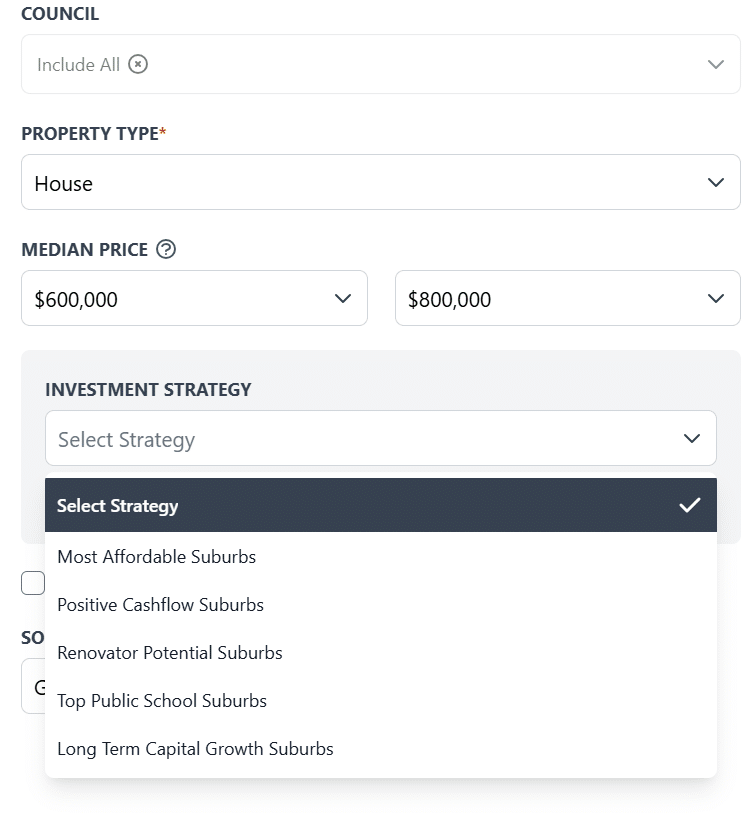
Refine your search using five powerful strategies
2. Customise your search to match your specific brief
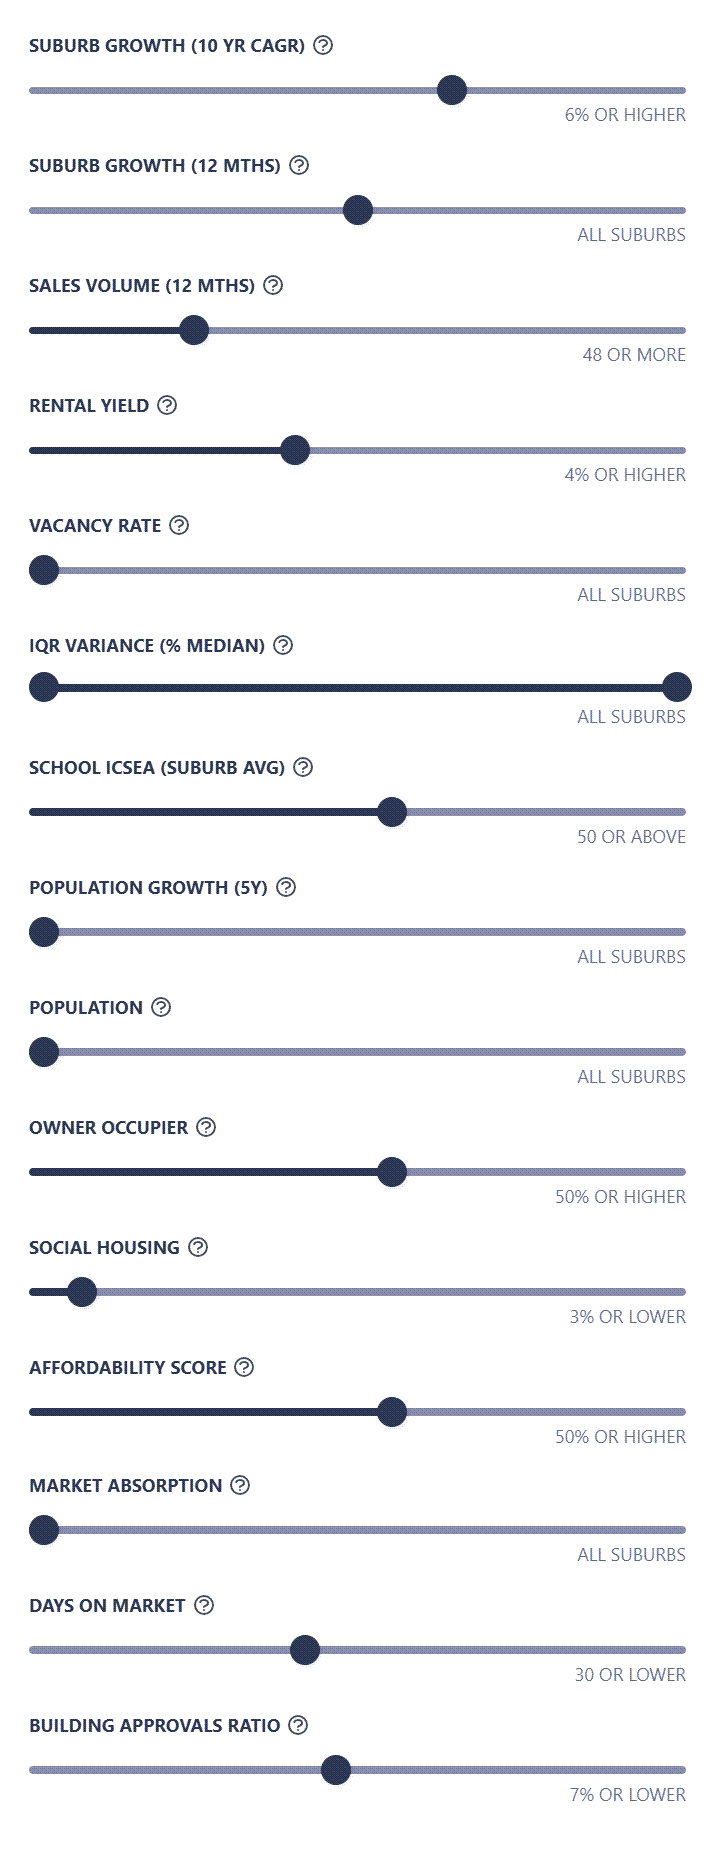
These filters help you pinpoint high-potential suburbs by analysing key investment metrics — from long-term growth and recent momentum to rental returns, affordability, and market activity. Whether you’re chasing capital growth, cashflow, renovator stock, or family-friendly locations, this tool lets you fine-tune your search across Australia’s 15,000+ suburbs to match your buying strategy.
Suburb Growth (10 Yr CAGR)
Measures the compound annual growth rate of median property prices over the past decade. Ideal for identifying suburbs with consistent long-term capital growth and proven market resilience.
Look for: Higher % growth the better
Suburb Growth (12 Mths)
Shows price change over the past year. Helps spot suburbs with short-term momentum, whether in early growth phases or potential market corrections.
Look for: Have you missed the boat? Past success doesn’t guarantee future success.
Sales Volume (12 Mths)
Represents the number of properties sold in the last year. Higher sales volumes indicate stronger buyer demand and liquidity, making it easier to enter and exit the market.
Look for: e.g. 4 sales a month is 48 a year
Rental Yield
The annual rental income as a percentage of property value. Key for identifying cashflow-positive suburbs and comparing return potential across locations.
Look for: Higher % yield the better, though be wary of other factors e.g. mining towns.
Vacancy Rate
Shows the percentage of rental properties currently vacant. Lower rates suggest strong tenant demand, reducing holding costs and risk of rental loss.
Look for: Lower % vacancy rate the better
IQR Variance (% Median)
Interquartile range as a percentage of median price, highlighting price variability. A high IQR % can signal renovator opportunities or pricing gaps between unrenovated and upgraded homes.
Look for: 30% to 60% is a good range for identifying mixed price suburbs
School ICSEA (Suburb Avg)
The average ICSEA score for schools in a suburb, reflecting educational advantage. Higher scores attract families and underpin strong demand in owner-occupier markets.
Look for: 90+ is the Top 10% of schools
Population Growth (5Y)
Tracks population change over the last five years. Positive growth supports housing demand, infrastructure investment, and price appreciation.
Look for: This will highlight post CO-VID growth. High is good (though ensure low building approval ratio to ensure it’s not new developments driving the change)
Population
Indicates the size of the suburb’s population. Useful for distinguishing between small regional towns and large metro catchments when planning investment strategies.
Look for: Higher populate often the better
Owner Occupier
Percentage of homes occupied by owners. High rates often reflect community stability and property care, while lower rates can indicate investor-heavy or transient areas.
Look for: Do you want the property to be amongst renters or owners?
Social Housing
Proportion of dwellings designated as social or public housing. Useful for understanding the socio-economic profile and potential tenant base of a suburb.
Look for: Do you wants the property to be amongst lots of social housing?
Refine your search using advanced data points
Affordability Score
A measure of how affordable a suburb is relative to income and property prices. A high score indicates easier access for buyers and possible room for future growth.
Look for: Higher score means more affordable
Market Absorption
Assesses how quickly properties are selling relative to listings. High absorption rates suggest strong demand and upward pressure on prices.
Look for: If there were 10 properties on the market and 4 sold each month, it would be a 40% absorption rate. Higher the better.
Days on Market
The average time it takes to sell a property. Shorter durations reflect higher demand and active market conditions, which are ideal for quick resales or flips.
Look for: Lower days the better
Building Approvals Ratio
The volume of building approvals relative to existing dwellings. High ratios may signal future supply increases, while low ratios can reflect undersupply and potential upward price pressure.
Look for: You will want to see a low ratio e.g. 7% and below. Indicates how many new dwellings have been approved. A high number will mean the suburb is growing and could mean oversupply.
6. View Results on Map and Table
Once filtered, you can view your shortlisted suburbs:
- On an interactive map showing geographic distribution
- In a sortable table that lets you compare median prices, growth, and more
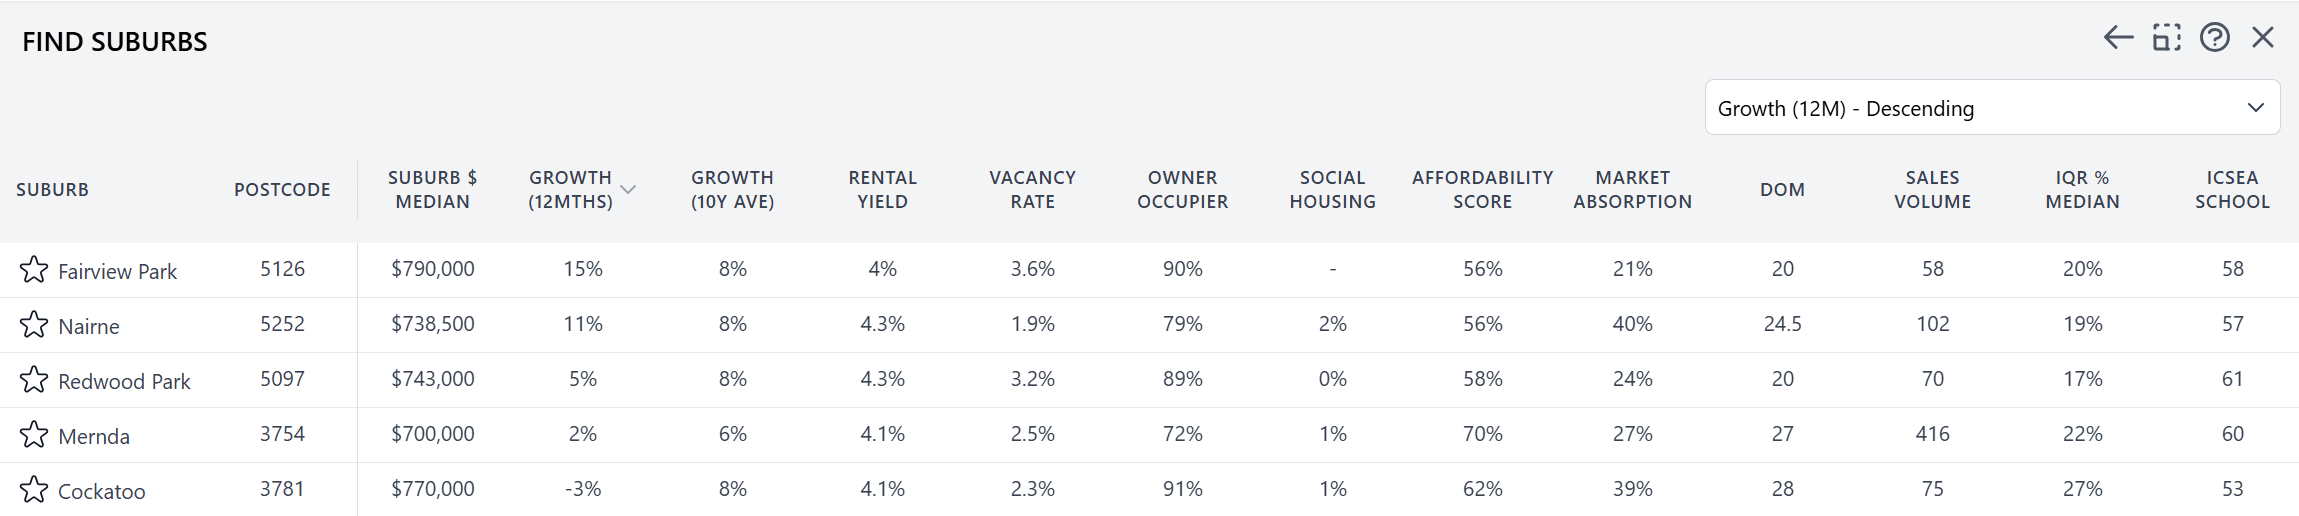
There are 5 suburbs that match this client’s brief.
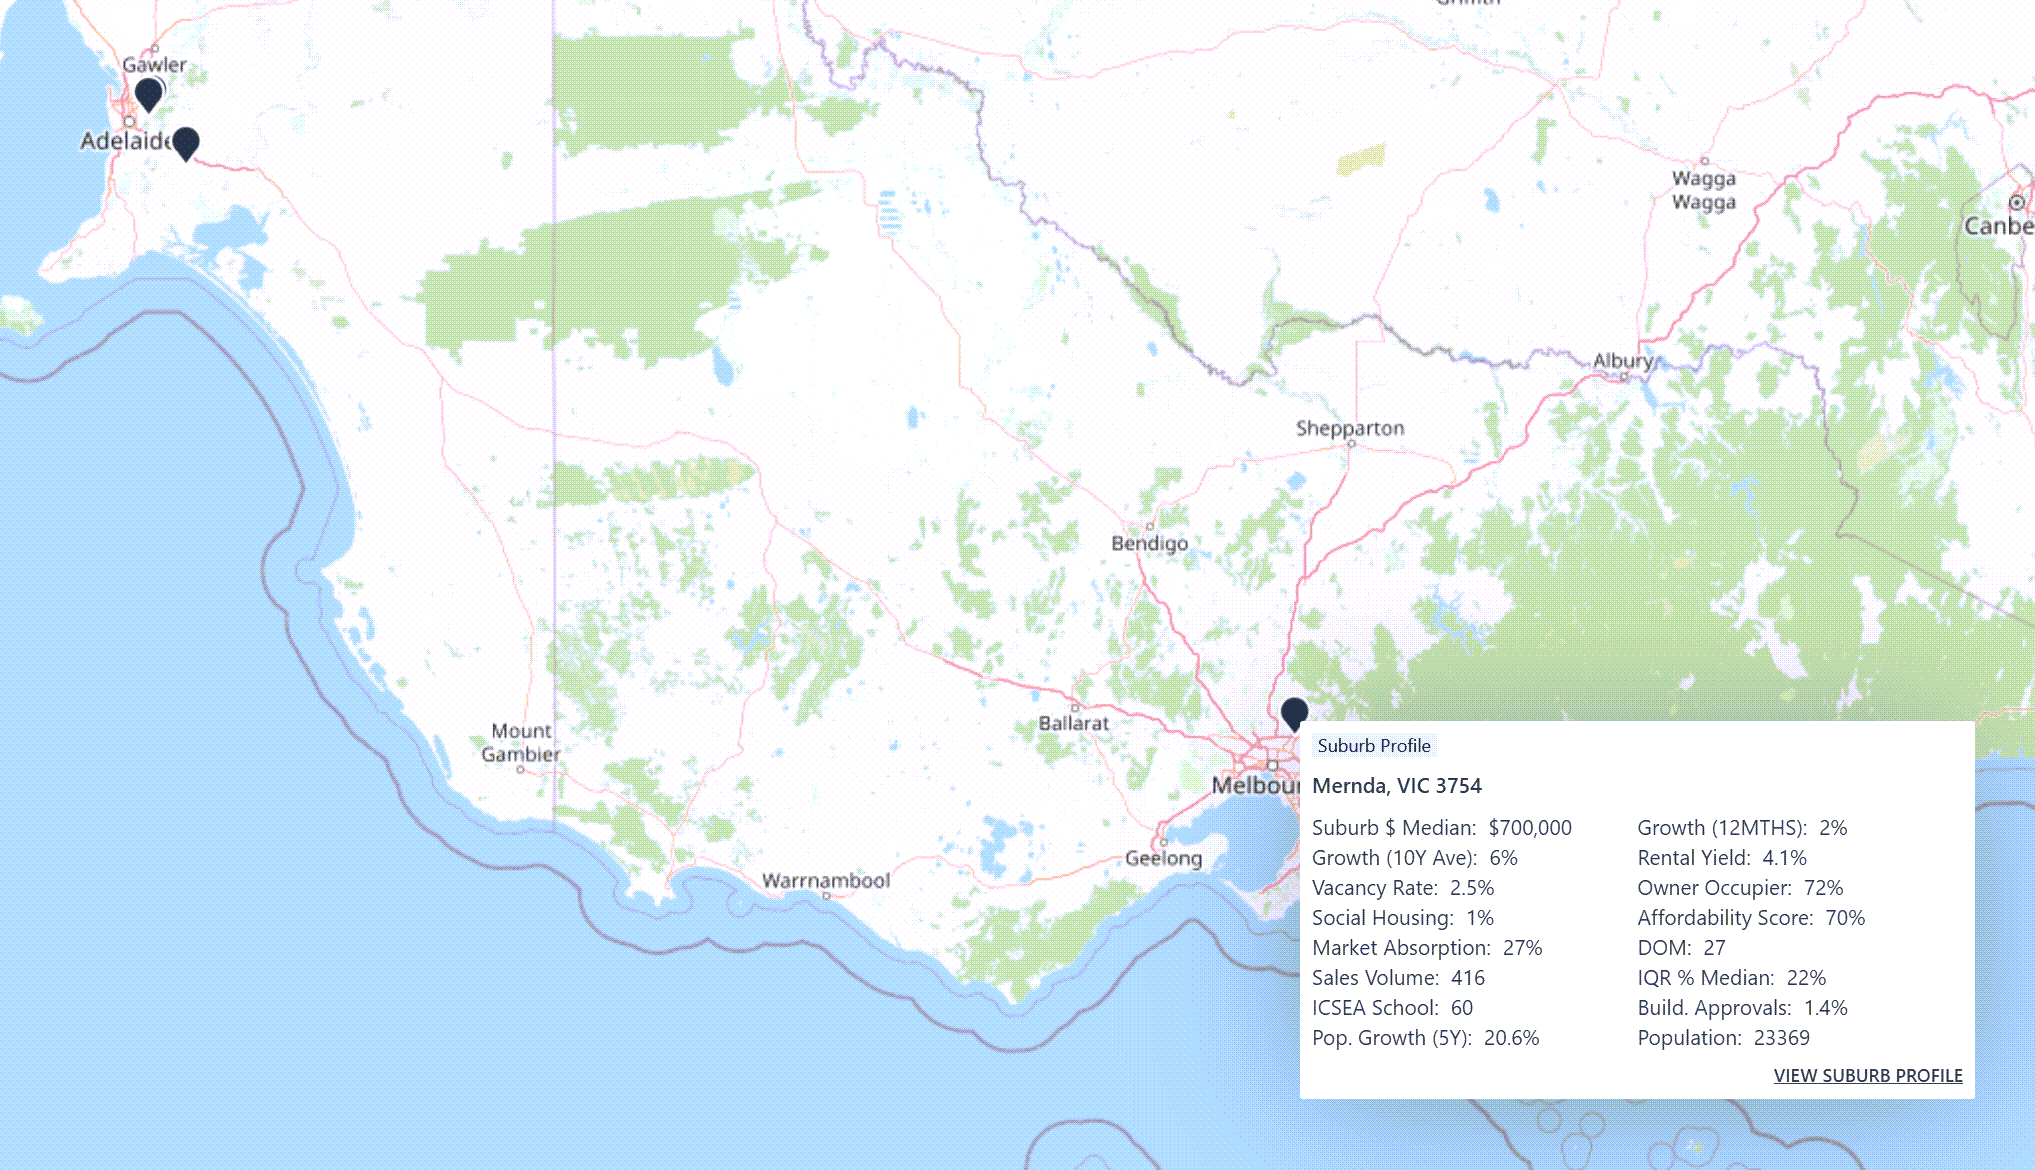
This makes it easy to visually understand where the best suburbs are located and how they stack up.
7. Export and share a professional report
Stash lets you export your final list into Excel for further analysis. You can also generate print-ready PDF reports, branded with your company’s logo, perfect for:
- Client presentations
- Lead generation
- Internal research
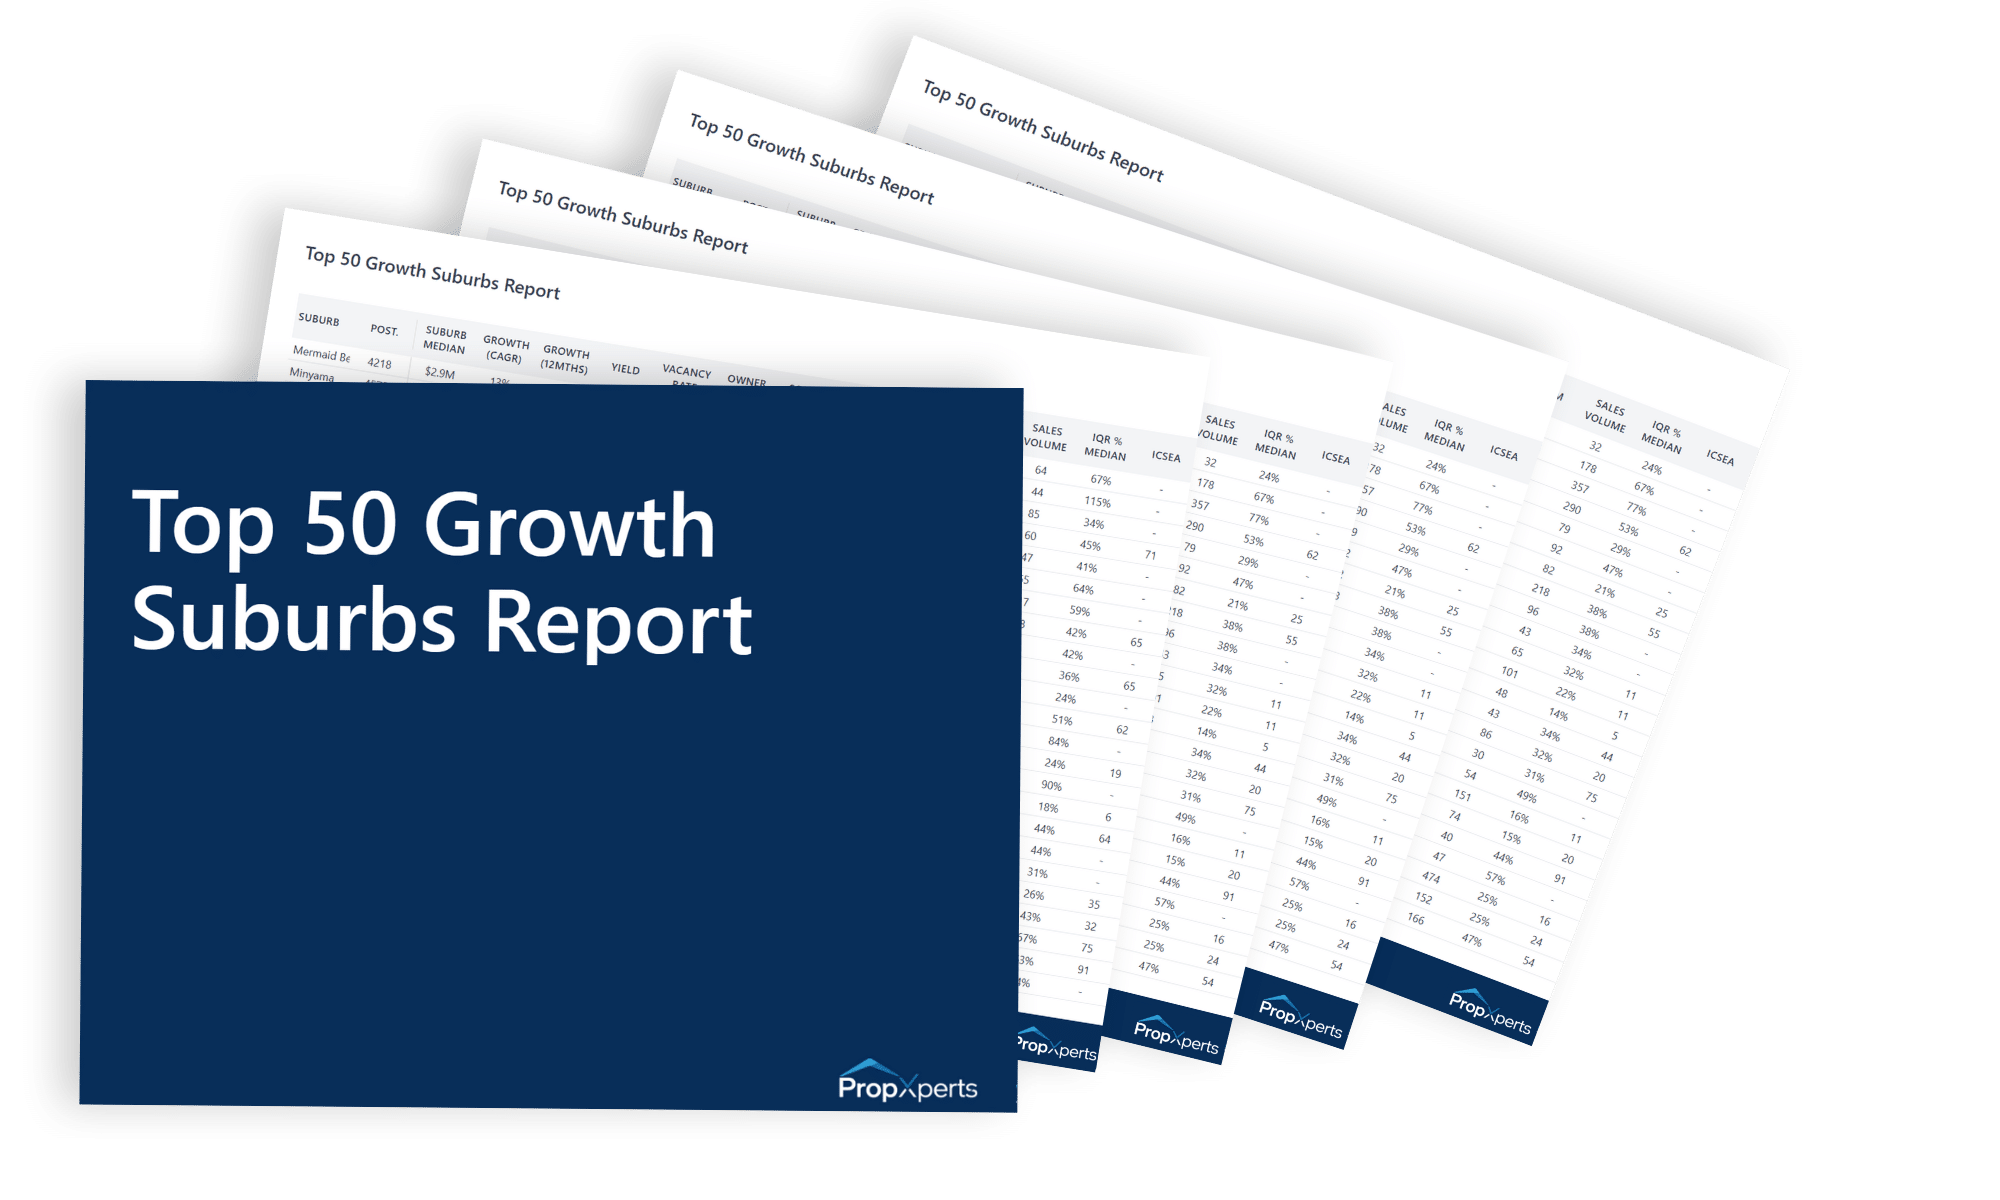
See how PropXperts create custom Top 50 Suburbs Reports to use as lead generation reports.
Consistent branding across every report helps reinforce your credibility and professionalism. It ensures your clients receive a unified message and presentation style, making it easier to compare properties and trust your recommendations.
With Stash, every CMA reflects your brand, streamlining communication and strengthening your position as a trusted advisor.