Updated November 2026: Stash now has more overlays (including heritage, biodiversity, boundaries and high voltage powerlines), the For Sale overlay has been replaced by the Find On Market Deals search, and recent aerials are now the Metromap Aerial basemap. The lists and steps below are current.
Map layers and overlays do really help when searching for certain properties especially for property development enthusiasts or even those newbies. Not only it makes data expression clearer and intuitive but makes the overlay of geographic data possible. Visualising and seeing the distribution of data in each suburb/state makes it easier to mine for deeper and specific information and make better decisions.
Our Stash interactive map allows you to click and select properties right away and gives you rewarding experiences and not just pretty pictures. The most valuable maps are information products that are visually interesting from the first time you see them. Yet they reward you with additional information as you explore and interact with the map. It really is a good thing to picture out how your prospect property looks and check other information/factors that may help you with your research and decision making.
This definitely gives Stash a whole new look and we’ve made some makeover to our platform but still keeping the user friendly experience to our customers.
Why do we need Map Layers?
1. Adds context to your maps
Layers make maps more contextual and help you focus on specific aspects like assets, roads, and points of interest. Map layers make it easier for you to work on a specific set of objects in your map.

2. Helps you detect change faster
With a map layer, you see how various measures and metrics are changing over time. For example, the property developers can track those properties which are already developed and exclude this from their list of areas to be developed.
Reference: https://towardsdatascience.com/map-layer-types-and-use-cases-d22a2a788b0e
Great maps don’t just happen automatically, though. You have to put a little bit of yourself into the effort, and do some finishing touches to make it more unique. The data you are mapping won’t tell its story without your help.
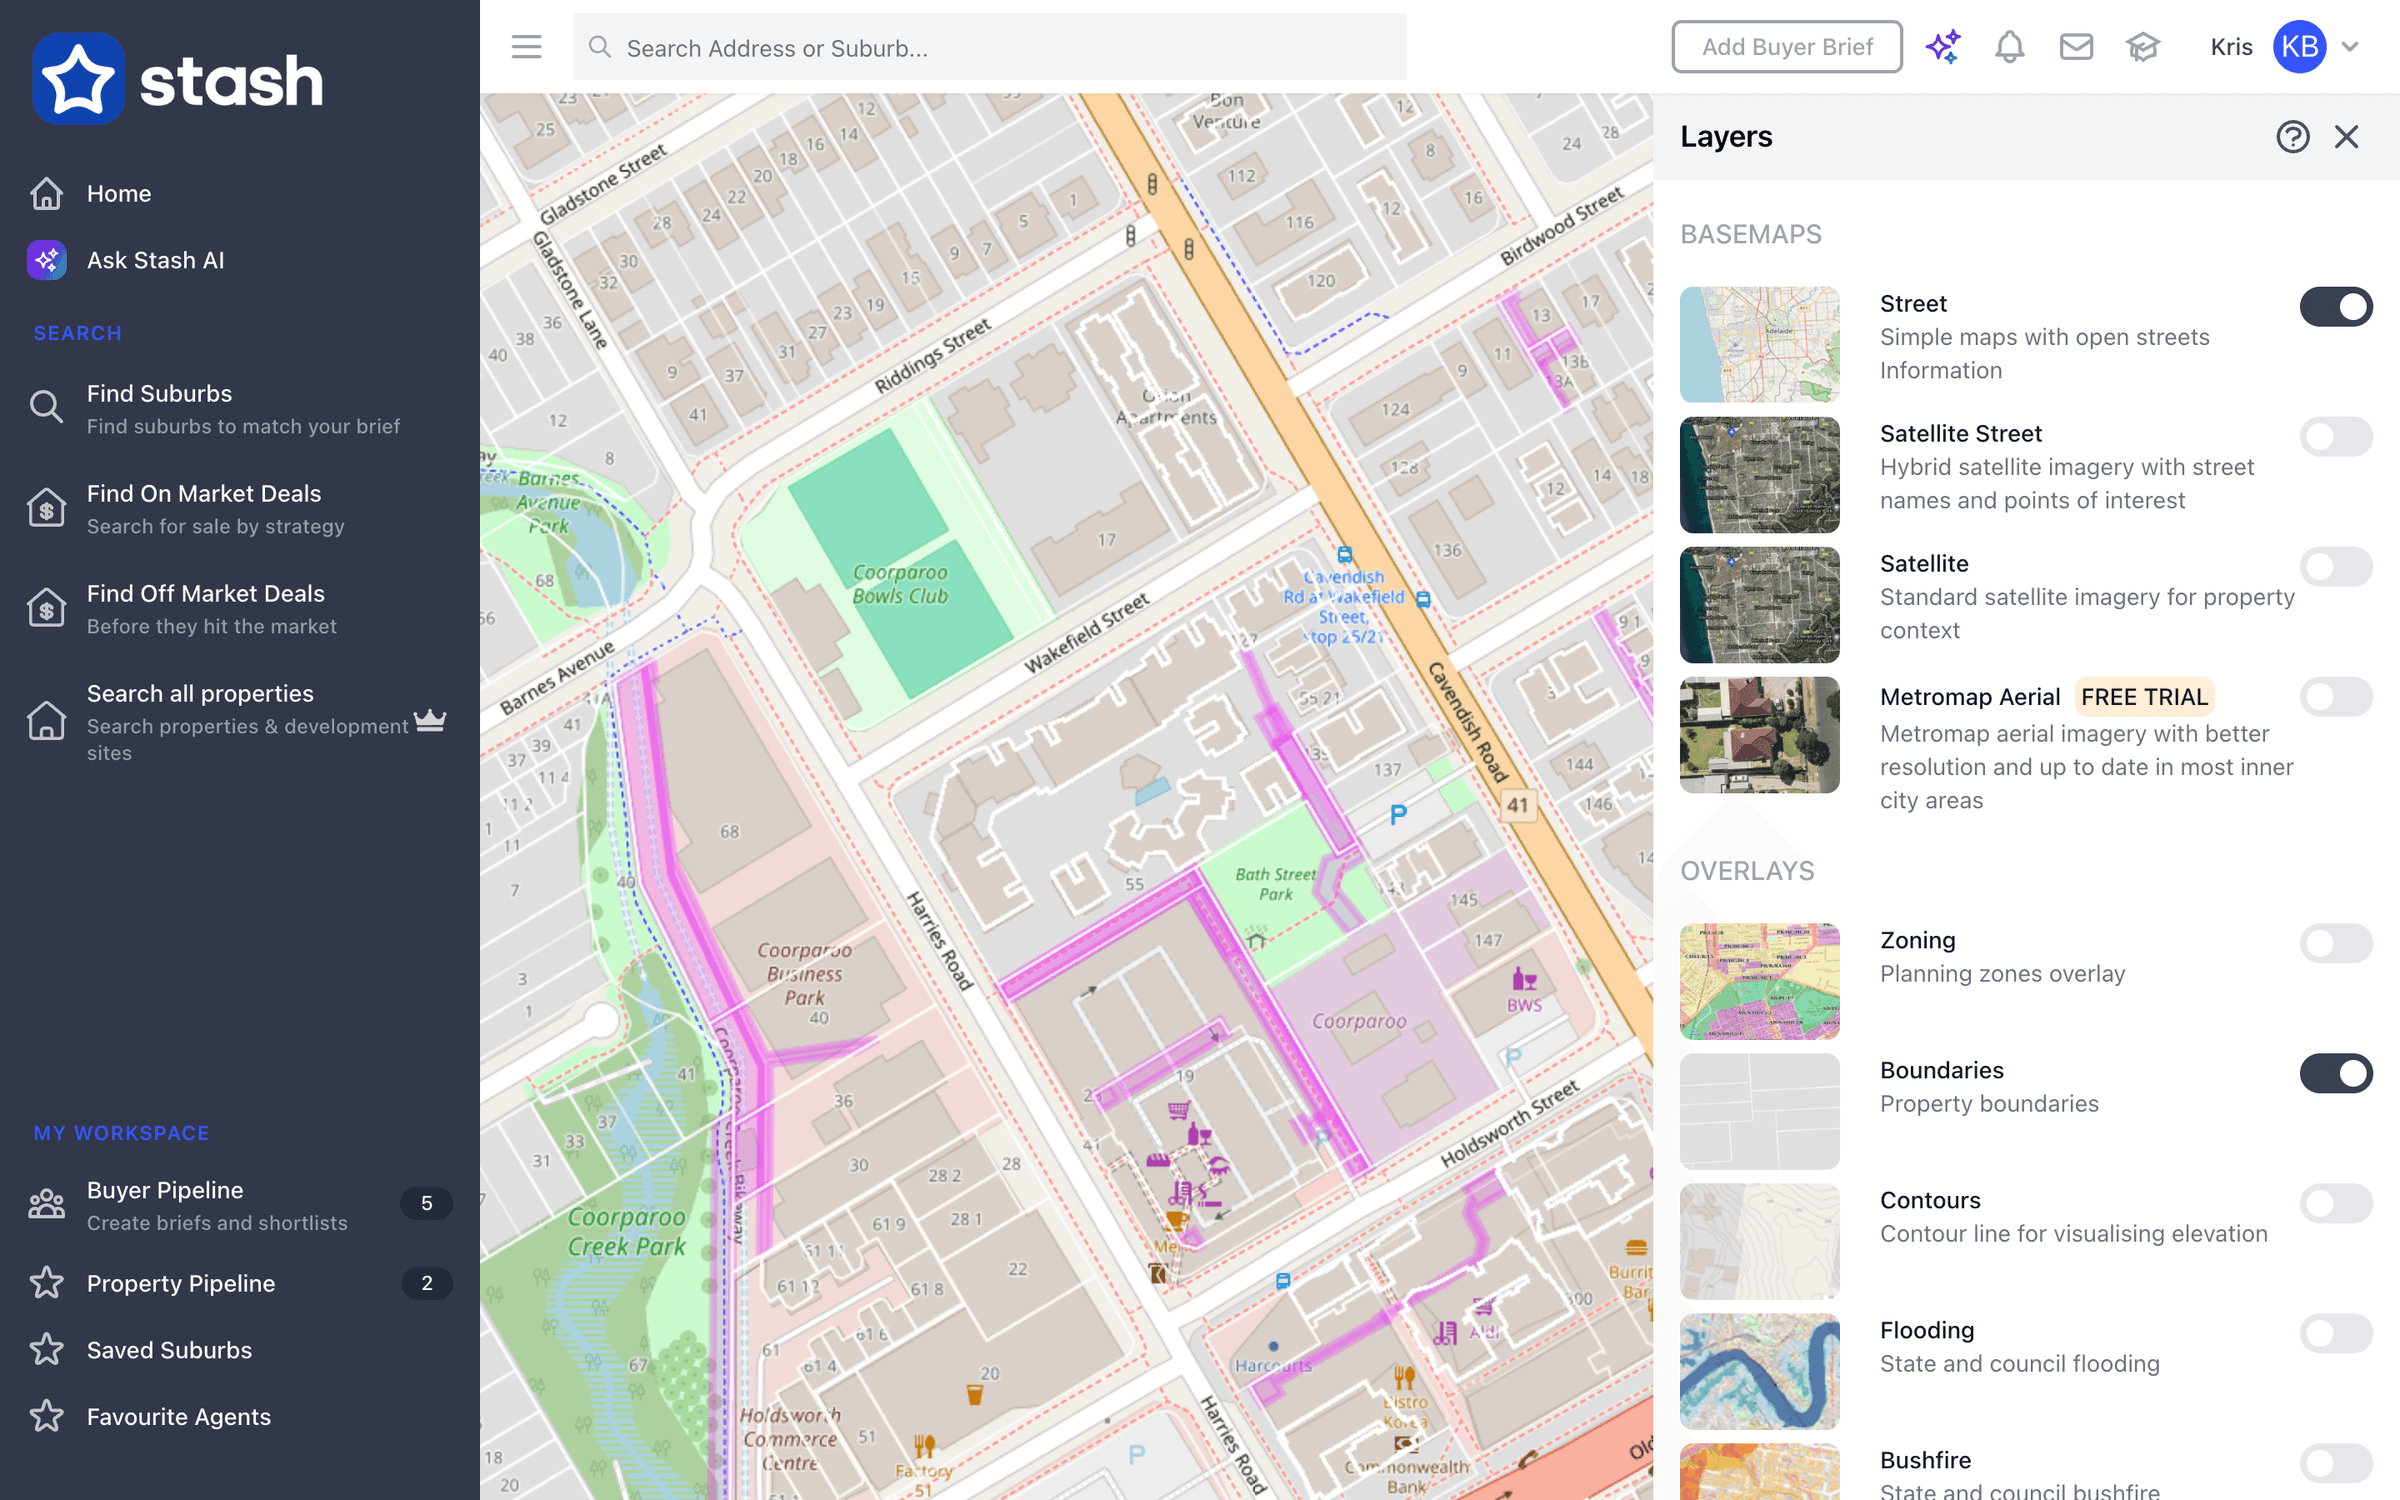
This is why we made sure that some of our existing layers are kept in our new version, namely the Street, Satellite and Recent aerial maps layers (today the basemaps are Street, Satellite Street, Satellite and Metromap Aerial). Aside from the fact that it helped you locate properties, it also gives additional information towards our customers and viewers. With the Aerial maps, it enables our customers to check on recently developed properties and check those properties that are prospects for new developments.
Layers:
- Street map
- Satellite map


- Metromap Aerial map (a paid add-on with higher-resolution aerials, updated many times a year in most capital cities. See Turn on recent aerial imagery.)

The aerial maps imagery is really of big help to avoid targeting properties that are already developed. Learn more through our blog for Aerial maps.
With the efforts of our Development team, the following overlays were also added to make sure that our customers have richer information when doing their property search.
Overlays:
- For Sale – this allows our customers to check on properties which are listed/for sale. November 2026: For Sale is no longer a map overlay. To see listings, use Find On Market Deals in the side menu. See Find on-market deals.
- Contours – view the elevations of the properties if they are located on a flat area, sloping, or the land is steep. Contours only show when you zoom in to street level. See View contours.
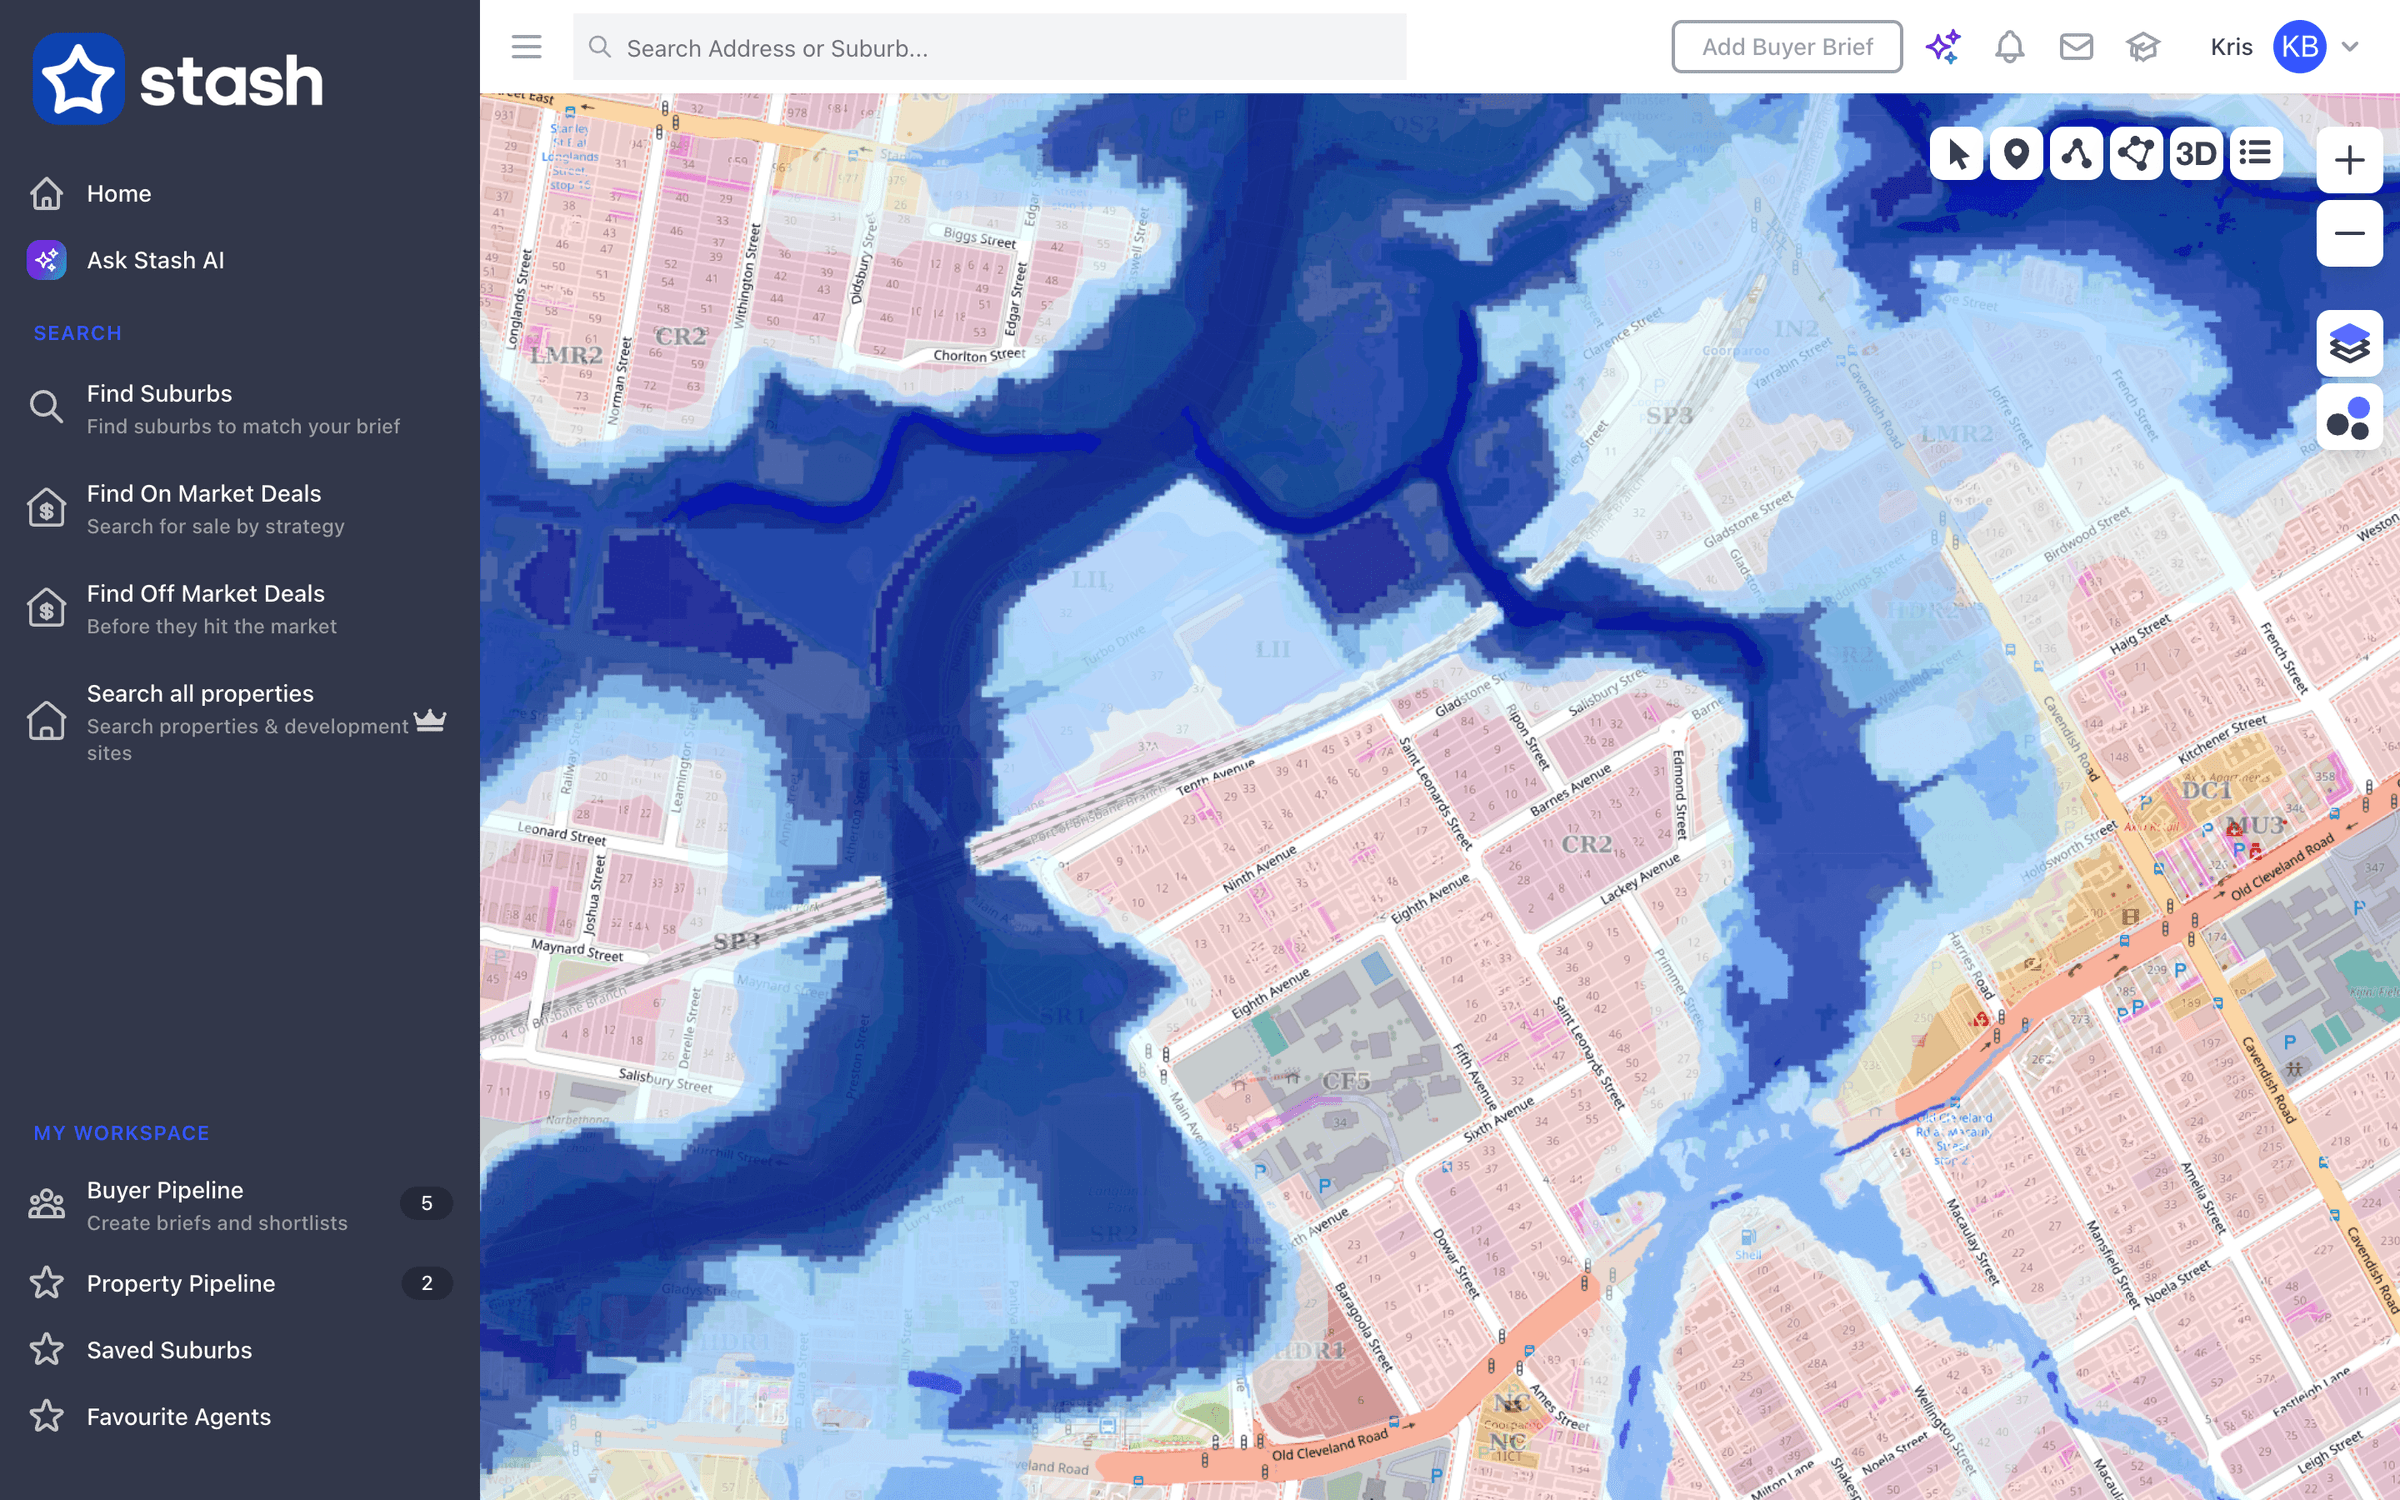
- Flooding and Bushfire – allows our customers to check on hazard prone areas and visualise the intensity of the hazards through its colours. Today these are two separate overlays, Flooding and Bushfire, built from state and council mapping. A flood overlay is a planning map showing land the council or state has identified as at risk of flooding. It can mean extra rules for building, such as minimum floor levels, so check the council’s planning scheme for what applies to a property. Learn more on our blog about Bushfire and Flooding layers.
- Zoning – gives a better understanding on what zone the property belongs to just by looking at the map through the colours that each zone indicates. See View zoning on the map.
- Added since 2022 – Boundaries, Heritage (see Heritage register layers), Biodiversity (see Biodiversity layers), High Voltage Powerlines, Dimensions, My Drawings, My Pipeline, Proximity Circles, and Custom MVT Vector Overlay and Custom WMS Layer for adding your own map service.


How to check the map layers and overlays in Stash today
To check the map layers and overlays inside Stash, just simply follow the steps below:
- Go to your target property or area on the map.
- Click the Layers button on the right-hand side of the map.
- Under Basemaps, switch on the one you want (only one shows at a time). Under Overlays, switch on as many as you need.
- Close the panel. Your overlays stay on as you move around the map. Use the Street basemap with overlays for the best contrast.
A lock icon next to a layer means it isn’t included in your plan. To check a single property without the map, open the property’s Planning Insights tab: the Risks & Planning Overlays card shows whether flooding, bushfire, heritage or biodiversity is detected, with the source. For suburb-level colours such as median price or rental yield, use the separate Heatmaps button. Full details: Map layers and overlays.
Overlays are for research. Rules and mapping change, so confirm the current overlays with the council or a town planner before you buy or build.
Want to try it? Start a free trial, or log in to Stash and open the Layers panel.
Happy Stashing!